

AYA Solutions
Helping each other can make world better
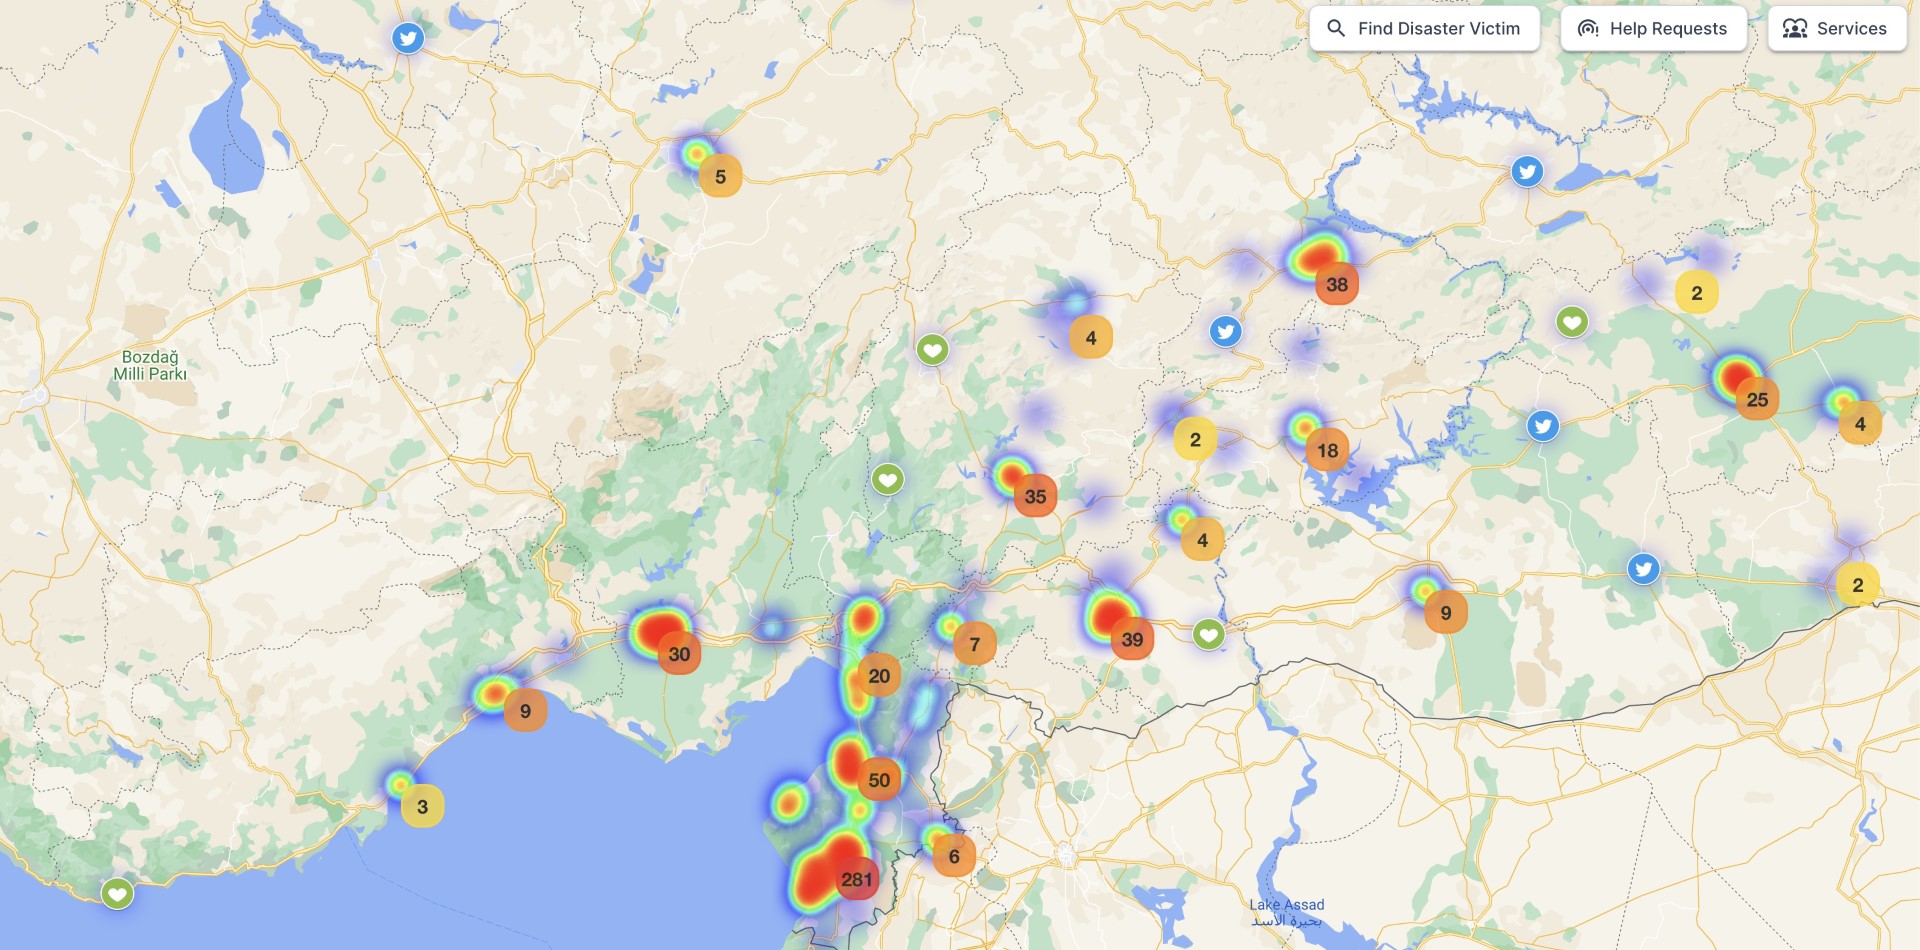
At AYA, we provide platforms and solutions that are designed to make a difference in times of crisis. Our flagship product, Afet.org, is a disaster map that was developed in response to the 6 February Kahramanmaraş earthquake. It has since been used to gather information on relief efforts, support requests, and search and rescue requests shared by social media platforms, websites, civil society organizations, associations, aid organizations, the media, public institutions, and organizations. Our solution processes this data to make it usable in the field and aims to support relevant institutions and NGOs using information technology and provide a clear and accessible data platform during times of disaster.
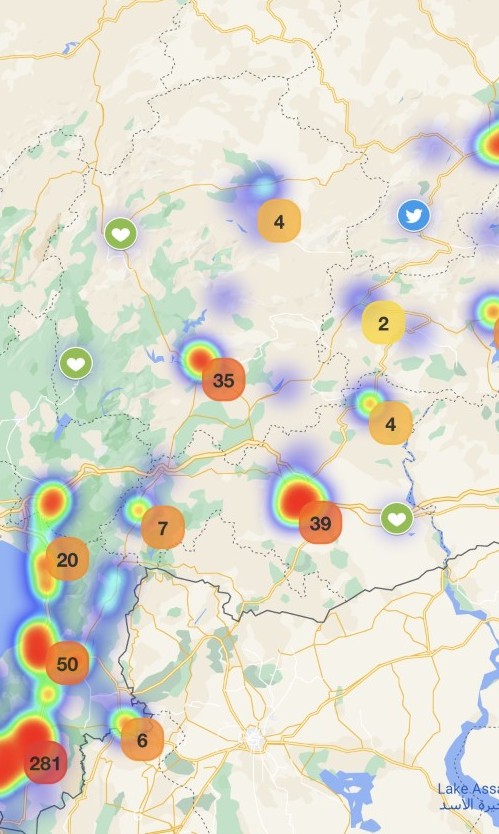
With data crawling capabilities from multiple social media sources and trained AI and ML models, our platform captures the needs and addresses them efficiently. The map-based data visualization feature of our platform provides an easy way to locate and analyze the information. Users can filter data based on several categories, making it simpler to find the exact information they are looking for. Our platform also supports form-based inputs for needs and help requests. Users can fill out the necessary information and submit their request, which can be viewed and acted upon by relevant NGOs and organizations. This feature makes it easy for those in need to get help and for those who want to help to quickly find where their assistance is required. To make our platforms and solutions accessible to as many people as possible, we have made Afet Harita a fully open-source, dockerized, and well-documented project that can be used by anyone in the world in the event of future disasters. Our platform is also fully free and allow-listed, especially for NGOs.
We are constantly striving to improve and expand our capabilities. Join our community on GitHub and Discord to stay updated on our latest developments and contribute to our mission of using technology to make a positive impact in times of crisis.
Regarding images or screenshots, you may consider including a screenshot or demo video of the map-based data visualization feature, as well as screenshots of the form-based inputs for needs and help requests. Additionally, you may want to include images of the different categories that users can filter data by. These visuals can help give visitors a better understanding of how the platform works and its capabilities.